Rectangle Bottom Chart Pattern
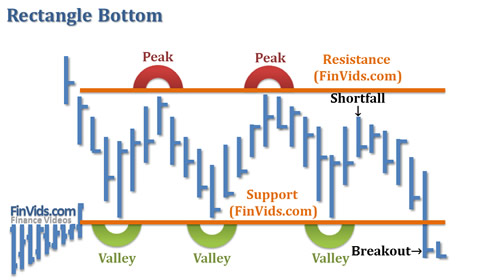
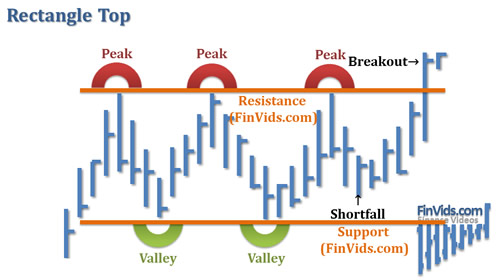
The rectangle pattern consists of two trendlines that are parallel (support and resistance) and usually the support and resistance lines are horizontal, but can slope up or down slightly. The support line is established by at least two valleys "W" and the resistance line is established by at least two peaks "M". When prices enter the rectangle pattern from above, it is called a rectangle bottom; in contrast, when prices enter the rectangle formation from below, it is called a rectangle top. Occasionally peaks can surpass the resistance line or a valley can fall below the support line, these are called false breakouts. In addition, sometimes prices can retrace downward from the resistance line but not go down far enough to touch the resistance line, and then begin to move back upward towards the resistance line; when this occurs, it is called a "shortfall" and can suggest the eventual breakout will be higher. The same is true for the opposite where prices rise up off of the support line but do not reach the resistance line and then fall back down towards the support line.
Rectangle Top Chart Pattern
Psychology of the Rectangle Chart Pattern
An area of resistance established by multiple price peaks shows traders that bears are willing and able to sell at that price level. Likewise, an area of support established by multiple price valleys shows traders that bulls are willing to come in and buy at that price level. Only when bulls are willing and able to overpower the bears can the resistance line be broken and only when bears are willing and able to overpower the bulls can the support line be broken. Traders who are willing to buy at an area of resistance must be confident that prices will rise because in order to make a profit they have to buy low and sell high; in the case of broken resistance, they must buy high and sell higher. When prices break and close above the resistance line, bears who probably shorted at the resistance line are at risk of having to buy to cover their losses, thus adding even more buying pressure to the breakout buying traders. The opposite applies to the area of support, traders who are willing to sell short at an area of support must be confident that prices will fall because in order to make a profit they have to sell low and buy to cover even lower. When prices break and close below the support line, bulls who probably bought at the support line are at risk of having to sell to end their losses, thus this adds even more selling pressure to the breakout selling traders.
Rectangle Buy and Sell Signals
A buy signal is suggested when prices breakout and close above the resistance line and a sell signal is suggested when prices breakout below the support line. Some traders suggest that it is possible to buy at support and sell at resistance given that the height of the rectangle is sufficient. However, for the most part, Kirkpatrick & Dahlquist (2010) advise against this strategy given the inherent price slippage of order execution and commission charges (p. 312).
Rectangle Bottom Breakout Direction
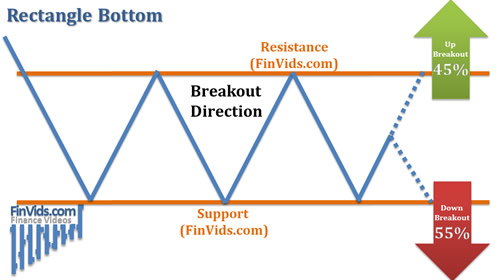
The Rectangle Bottom breaks out downward 55% of the time
Rectangle Bottom Price Gain/Decline Stats
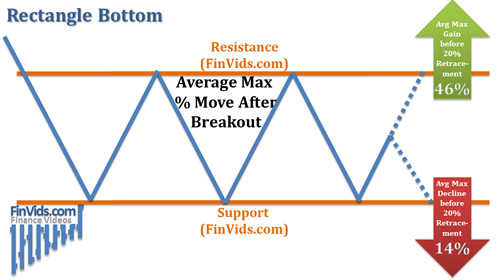
and the averaged maximum gain before any 20% correction after a breakout to the upside is 46%; whereas a breakout to the downside is an averaged maximum decline of 14%;
Rectangle Top Breakout Direction and Price Gain/Decline Stats
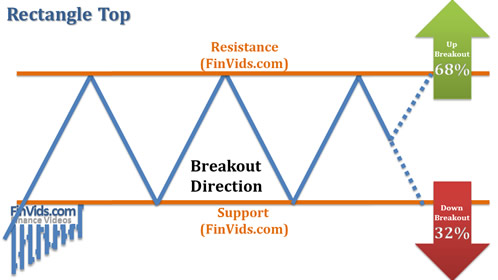
The Rectangle Top breaks out upward 68% of the time
Rectangle Top Price Gain/Decline Stats
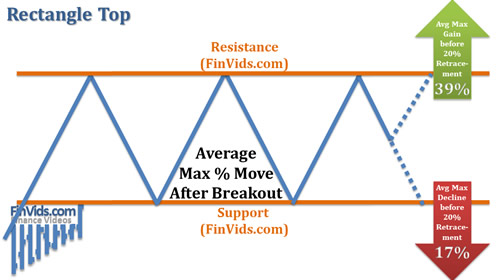
and the averaged maximum gain before any 20% correction after a breakout to the upside is 39% and the breakout to the downside is 17% (Bulkowski, 2005).
Rectangle Profit Targets
The typical technical analysis profit target is the height of the rectangle pattern plus the breakout price. However, Bulkowski (2008), based on in his research, has created four specific price targets for the rectangle pattern:
Rectangle Bottom Breakout Above Chart Example
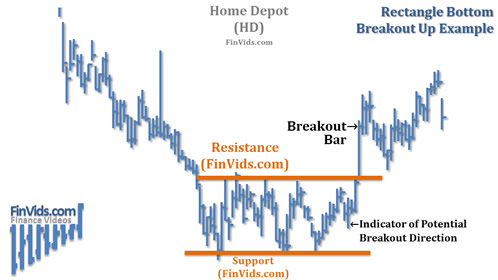
The chart above of Home Depot (HD) shows a rectangle bottom (because prices enter from the top) and consists of three valleys that create a horizontal support line as well as four peaks that create the horizontal resistance line. Notice that there is a shortfall after the fourth peak that hints as to the direction of the breakout. According to Bulkowski (2005), with the rectangle bottom, a shortfall that does not retrace all the way down to support correctly hints at an impending breakout higher 81% of the time; whereas a shortfall that does not rise all the way up to resistance hints at a breakout lower 83% of the time.
Rectangle Bottom Breakout Below Chart Example
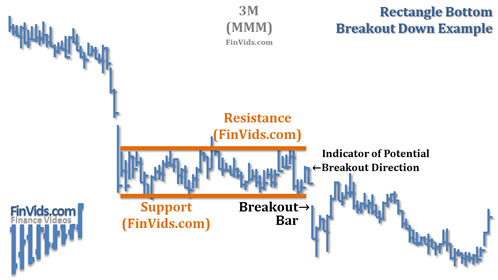
The chart above of 3M (MMM) is an interesting rectangle bottom with a breakout below support. Prior to the rectangle pattern, prices fall dramatically and enter from the top, thus creating a rectangle bottom as opposed to rectangle top. A rectangle forms with five valleys creating the support area. Note that, though not shown on the chart above, this area of support of the rectangle is at the same price as the support level six months previously. The resistance line is created by four peaks. Note that there is a sizeable breakout on the third peak; however, the price does not maintain its gains because the price closes at the resistance line rather than above the resistance line.
Also note that there is shortfall after the fifth valley that hints that the eventual breakout will be to the downside. Another interesting attribute of this chart is that there is a gap down breakout below resistance; therefore, a trader could only sell at the open of the day of the gap down which misses out on a lot of profit. However, if a trader did sell at the open and used the price target formula (Bottom of Rectangle – Height of Rectangle), that trader would have covered their short before the massive retracement back up towards the rectangle pattern.
Rectangle Top Breakout Below Chart Example
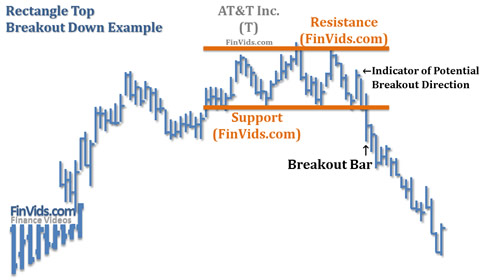
The chart above of AT&T (T) shows a Rectangle Top (because price enters the pattern from below) with three peaks, establishing resistance, and three valleys, establishing support. Note that after the third valley, a shortfall occurs where the move fails to reach the upper resistance line; this foreshadows a breakout downward. According to Bulkowski (2005), with the rectangle top, a shortfall that does not retrace all the way down to support correctly hints at an impending breakout higher 89% of the time; whereas a shortfall that does not rise all the way up to resistance hints at a breakout lower 61% of the time.
Rectangle Top Breakout Above Chart Example
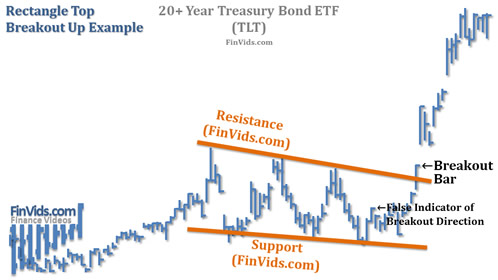
A slightly downward sloping Rectangle Top with a breakout above is shown on the chart above of the 20+ Year Treasury Bond ETF (TLT). Three valleys create the support line and three peaks create the resistance line. Note that the shortfall after the third valley failed to predict the eventual breakout direction, but financially, this is irrelevant because you don't buy or sell until prices actually close above resistance or below support.
Works Referenced
- Kirkpatrick II, C.D., & Dahlquist, J.R. (2010). Technical Analysis: The Complete Resource for Financial Market Technicians (2nd ed.). Upper Saddle River, NJ: FT Press.
- Rockefeller, B. (2011). Technical Analysis For Dummies (2nd ed.). Hoboken: John Wiley & Sons.
- The Pattern Site. (2008). Bulkowski's Measure Rule. Retrieved June 1, 2012, from http://thepatternsite.com/measure.html
- The Pattern Site. (2005). Bulkowski's Rectangle Bottoms . Retrieved June 1, 2012, from http://thepatternsite.com/rectbots.html
- The Pattern Site. (2005). Bulkowski's Rectangle Tops . Retrieved June 1, 2012, from http://thepatternsite.com/recttops.html
Click "Like" & "+1" for each page