Doji and Long-Legged Doji
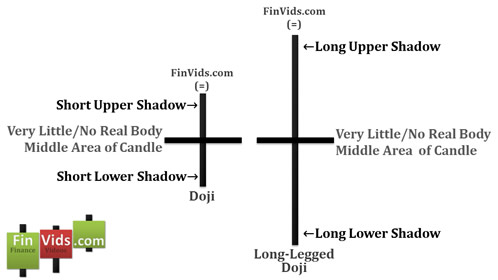
A doji is a single candlestick where the open and close price is equal or very close to the same. The doji signifies indecision by the market. The doji is considered to be an important reversal signal at market tops and market bottoms. Nison (1991, p. 151) states from his personal experience that dojis are best at calling tops, but are not as good at calling bottoms. He suggests that dojis at bottoms need extra confirmation. A doji often signals a top when during an uptrend a long bullish candlestick appears followed by a doji candlestick that appears above the close or within the real body of the previous day’s bullish candlestick. When a doji is seen after an uptrend, Nison (1991, p. 153) suggests selling any longs traders might have.
The long legged doji is a doji with long upper and lower shadows. When a long legged doji has the open and close in the middle of the upper and lower shadow, it is referred to as a rickshaw man.
Computer charting packages need very specific definitions of candlesticks to identify them on a chart. A precise definition given by ThinkorSwim (2011) is that the real body of the doji is less than 5% of the 20 day average of prior real body heights. A long legged doji is defined like the doji, where its real body is less than 5% of the 20 day average of prior real body heights, but also its shadows are at least 75% of the 20 day average of previous real body heights.
Psychology of Doji Candlestick
Bullish candlesticks show the ability of bulls to push prices higher; bearish candlesticks show the ability of bears to push prices lower. When a doji emerges, neither the bears nor the bulls have the ability or the desire to push prices in their desired direction; this indecision or inability to move the markets in one direction is what make a doji so important as a trend change candlestick pattern. When prices move upward, it is clear that the bulls have the ability and/or desire to push prices higher. When prices form a doji after an uptrend, it shows that bulls are unable or unwilling to push prices higher. If prices were pushed up too far too fast and are overbought, the bears seeing the doji might decide that now is the time to sell and push prices lower.
Bearish Gapping Doji Candlestick Pattern
Another doji pattern is the bearish gapping doji. During a downtrend prices gap down and then a doji appears. Bears were able to push prices lower but were unable to push prices even lower by the close of the day. There is much uncertainty after the close of the doji about where prices will move from here. Therefore, traders must wait for the next day. If the bulls are able to push prices higher and create a bullish candlestick then a bullish morning star candlestick pattern has emerged. If a bearish candlestick forms on the day after the doji, then the doji just acted as a breather for the bears and the downward trend should continue. This second day bearish candlestick confirms the gapping doji pattern.
Bullish Gapping Doji Candlestick Pattern
In contrast, a bullish gapping doji happens during an uptrend when prices gap up and then a doji appears. Bulls were able to push prices higher but were unable to push prices even higher by the close of the day. There is much uncertainty after the close of the doji about where prices will move from there onward. As a consequence, traders must wait for the next day to confirm. If the bears are able to push prices lower and create a bearish candlestick then a bearish evening star candlestick pattern has emerged. If a bullish candlestick forms on the day after the doji, then the doji was essentially a day of rest for the bulls and therefore, the upward trend should continue. This second day bullish candlestick confirms the bullish gapping doji pattern.
Doji Top Reversal Candlestick Chart Example
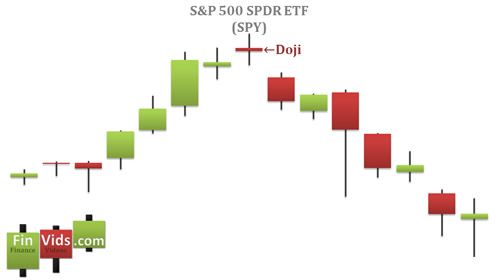
The chart above of the S&P; 500 ETF (SPY) shows three different examples of a doji acting as a top reversal. The first example occurs right after a very large bullish candlestick. The doji opens below the close of the bullish candlestick and actually creates a bearish harami cross pattern. The doji as a top reversal was confirmed by the following day’s bearish candlestick. The next example consisted of two dojis. The first doji followed a large bullish candlestick and established the high price for the top. The second doji opened a little higher and matched the high price of the previous day’s doji. The top was confirmed with the next day’s bearish candlestick. The third example starts with another bullish candlestick. The doji’s high price hits a resistance area established eight days prior and the price is brought back to the open, thus creating a doji. The next day’s long bearish candlestick confirmed the doji market top.
Doji Bottom Reversal Candlestick Chart Example
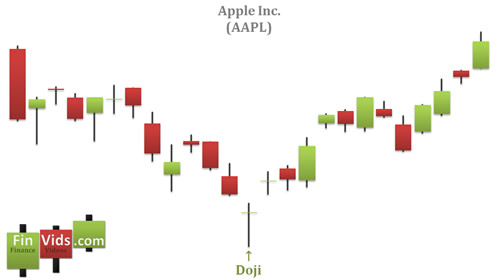
Though, according to Nison, dojis are not as effective at predicting bottoms as they are at predicting tops, dojis can be seen at bottoms that successfully reverse the trend upward. An example of this is shown on the chart of Apple (AAPL). After a long downtrend a large doji appears with a long lower shadow that, like a hammer, tests how far bears are allowed to go down by bulls before bulls begin buying and pushing prices higher. The indecision of the bears was rejected the following day by a large gap upward.
Doji at Top and Bottom Example
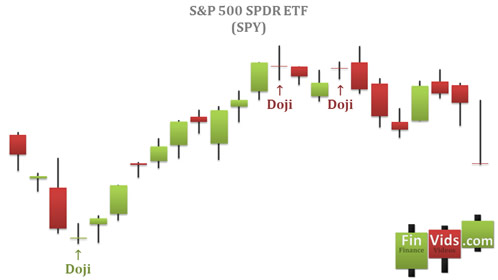
The example of the S&P; 500 ETF (SPY) illustrates a bottom established by a doji and then a top established by a doji. The bottom is established by a large bearish candlestick that is met the next day by an indecisive doji. The low of the doji established an area of support that is tested the next day by the bullish candlestick that confirmed the bottom reversal. An uptrend proceeded until another doji occurred. This doji established an area of resistance with its high price. The next day’s bearish candlestick confirmed the pattern; however prices didn’t fall as expected. A few days later another doji appeared. After the large bearish candlestick tested the high established by the first doji candlestick, the prices began to fall and confirmed the top reversal.
Bearish Gapping Doji Candlestick Pattern Example
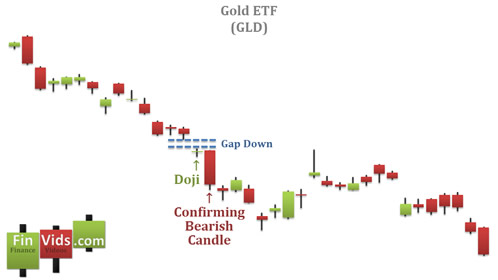
The chart above of the Gold ETF (GLD) shows a bearish gapping doji. After a multi-week downtrend a gap occurs. An indecisive doji with a very small upper and lower shadow appeared suggesting neither bulls nor bears were able to push prices in any direction. However the uncertainty of the day’s doji is cured by the following day’s very large bearish candlestick that confirmed the direction of the gapping doji was indeed downward.
Bullish Gapping Doji Candlestick Pattern Example
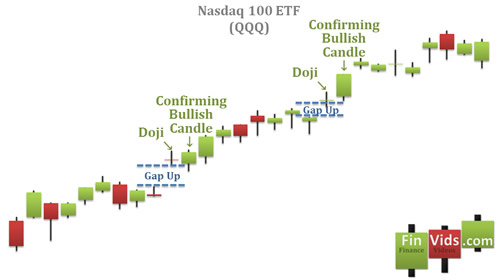
The chart above of the Nasdaq 100 ETF (QQQ) shows two bullish gapping dojis. In each example, a gap is followed by a doji with small upper and lower shadows. Only after the following day when a bullish candlestick appears is the indecisiveness of the previous day’s doji solved.
Works Referenced
- Nison, S. (2003) The Candlestick Course. Hoboken: John Wiley & Sons.
- Nison, S. (1994) Beyond Candlesticks: New Japanese Charting Techniques Revealed. New York: John Wiley & Sons.
- Nison, S. (1991) Japanese Candlestick Charting Techniques. New York: New York Institute of Finance.
- Rhoads, R. (2008) Candlestick Charting For Dummies. Hoboken: Wiley Publishing.
- ThinkorSwim. (2011). ThinkorSwim Resource Center: Candlestick Patterns Library.
Click "Like" & "+1" for each page