Hammer Candlestick
The Hammer candlestick is a bullish reversal pattern that develops during a downtrend. According to Nison (1991) the Japanese word for this candlestick pattern is "takuri" which roughly translates to "trying to gauge the depth of the water by feeling for its bottom" (p. 29). The long lower shadow, that by definition should be twice the height of the real body, is an area where bears were able to push prices lower, but met resistance by bulls that were able to push prices back toward the upper end of the candlestick.
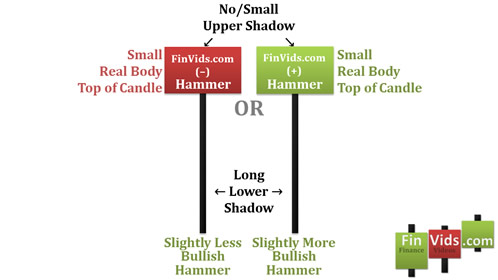
- The hammer should have no upper shadow, but can have an upper shadow if it is relatively small.
- The real body should be at the top of the candlestick trading range. This real body can be bullish or bearish, but preferably bullish.
- The lower shadow should be at least twice the height of the real body.
An example of a computer charting package definition of a hammer is given next (ThinkorSwim, 2011):
- The real body of the hammer is 30% of the average real body height over the past 20 trading sessions.
- The lower shadow must be at least 2 times the height of the real body.
- The trend over the past 3 trading sessions is downward.
If the real body of the hammer is bullish it can be inferred from the candlestick that bears were able to push prices down earlier in the trading session, but bulls were able to counterattack, eventually raising prices to a new high for the trading session. This could be interpreted as bullish for the future.
Longer Lower Shadow is More Bullish
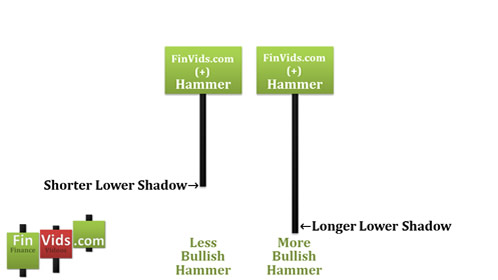
Steve Nison (1991) claims that "the longer the lower shadow, the shorter the upper shadow and the smaller the real body the more meaningful the bullish hammer. . .it is slightly more bullish if the real body of the hammer is [bullish]" (p. 29).
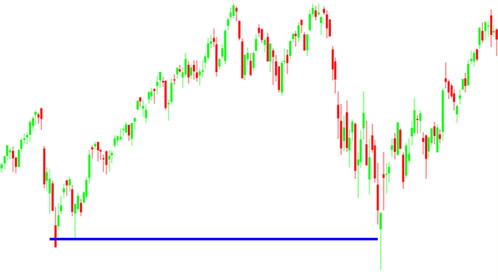
Hammer Candlestick Chart Example
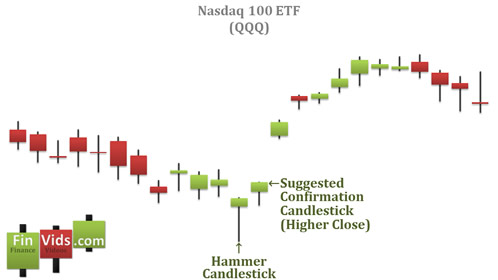
The chart above of the Nasdaq 100 ETF shows a downtrend that is ended by a hammer with a long lower shadow. The long lower shadow illustrates the market seeking out an area of support which it finds when bulls begin buying and pushing prices up towards the open. A suggested confirmation candle closes higher than the hammer's close and an uptrend commences.
Hammer Testing Upward Trend Line
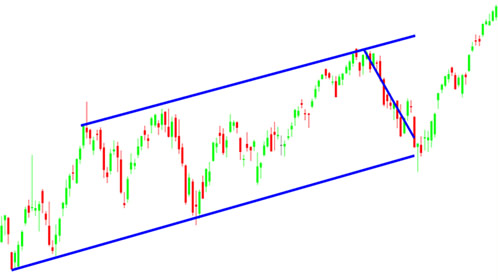
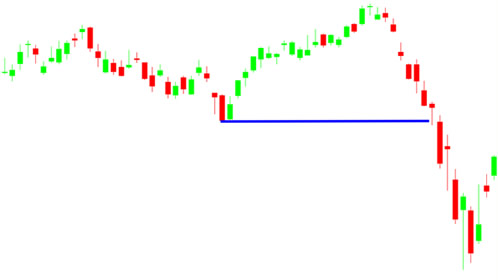
The hammer candlestick pattern is often seen testing support lines and trend lines to verify their strength. Often the long lower shadow of a hammer pierces through the support or trend line, but the bears are unable to close below those areas of support; instead, bulls are able to push prices higher and close above the area of support and thus keeping the support line or uptrend intact.
The following chart of the S&P; Mid-Cap 400 SPDR ETF (MDY) shows an upward sloping price channel. The blue line going down from top left to bottom right illustrates that prices were moving from the top part of the price channel to the bottom part of the price channel, thus fulfilling the requirement that a hammer candlestick is only valid if it occurs after a downtrend. The lower shadow of the hammer pierced below the bottom of the upward sloping price channel. However, by the end of the day, the bulls pushed prices back above the price channel closing the day at the high and preserving the integrity of the support line.
Nison Aggressive Buy Signal
For aggressive traders, Nison (1994) suggests going long right after the hammer candlestick appears. He suggests placing a stop loss under the low of the hammer. In contrast, for less aggressive traders, Nison suggests that traders wait until prices retest the hammer's support area and then buy (p. 57).
The chart above of the S&P; Mid-Cap 400 SPDR ETF (MDY) shows an example of where only the aggressive hammer buying method would have worked. A trader would buy near the close of the day when it was clear that the hammer candlestick pattern had formed and that the prior support level had held. If the trader had waited for prices to retrace downward and test support again, the trader would have missed out on a very profitable trade.
Rhoads Next Day Open Confirmation Buy Signal
Rhoads (2008) suggests waiting until the next trading session's opening price to determine whether to buy. If the second day opening price is greater than the hammer candle's closing price then go long, if the open is lower than the hammer candlestick's closing price then abandon the hammer candlestick chart trade signal (p. 119).
A hammer candlestick appeared on the chart of Exxon Mobil (XOM) after six prior days of bearish candlesticks and reaching a historical support area. By being aggressive, a trader could buy the close of the hammer candlestick formation and place a protective stop loss order at the low of the hammer candlestick. However, by being patient and waiting for the opening price of the day after the hammer candle to be above the closing price of the hammer, a trader would have prevented a quick one-day 1.7% loss.
Works Referenced
- Nison, S. (2003) The Candlestick Course. Hoboken: John Wiley & Sons.
- Nison, S. (1994) Beyond Candlesticks: New Japanese Charting Techniques Revealed. New York: John Wiley & Sons.
- Nison, S. (1991) Japanese Candlestick Charting Techniques. New York: New York Institute of Finance.
- Rhoads, R. (2008) Candlestick Charting For Dummies. Hoboken: Wiley Publishing.
- ThinkorSwim. (2011). ThinkorSwim Resource Center: Candlestick Patterns Library.
Click "Like" & "+1" for each page