The Advance Block and Stalled Pattern (also known as the Deliberation Pattern) are candlestick patterns made of three bullish candlesticks that often occur during an uptrend and warn of a slowing uptrend, but not necessarily a trend reversal.
Advance Block Candlestick Pattern
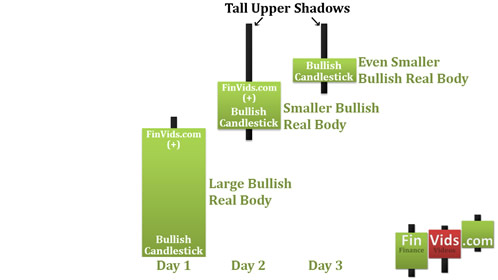
The advance block pattern occurs when on the first day a long bullish candlestick appears followed by another long bullish candlestick that opens within the real body of the first day’s real body and closes above the first day’s close and high. Also, a long upper shadow should appear on this second day. The third day is a small bullish candlestick that usually opens within the second day’s real body and closes above the second day’s close; it should have a upper shadow as well. The focus of this pattern is that the market is making new highs, but the bullish candlesticks’ real bodies are getting progressively smaller as prices make these new highs. The upper shadows are showing that bulls wish to push prices higher, but during the day the bears are able to successfully push prices down off of the highs and the bulls have to settle for gradually smaller gains.
For a definitive definition, ThinkorSwim (2011) charting package defines the advance block as:
- Each candle is bullish
- Each candle opens within the real body of the previous candlestick
- The second day’s candlestick real body must be 70% or less of the first day’s real body and the third day’s real body must be 70% or less of the second day’s real body.
- The second and third day have a long upper shadow that is at least 75% of the height of the prior 20 day average of candlesticks’ real bodies.
Stalled Candlestick Pattern or Deliberation Candlestick Pattern
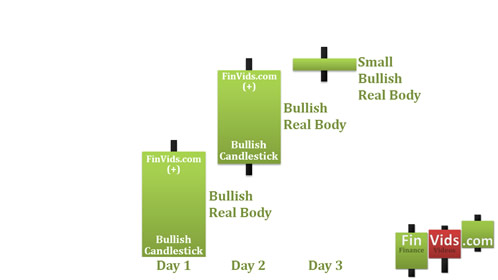
The stalled pattern or deliberation pattern is like the advance block in that it occurs during an uptrend and warns of a slowing uptrend and is made up of three bullish candlesticks. The defining characteristic is the third day is a small candlestick that gaps up like a star or is located at the upper end of the second day’s bullish candlestick real body much like a harami pattern.
Advance Block and Stalled Candlestick Pattern Suggest Selling of Longs
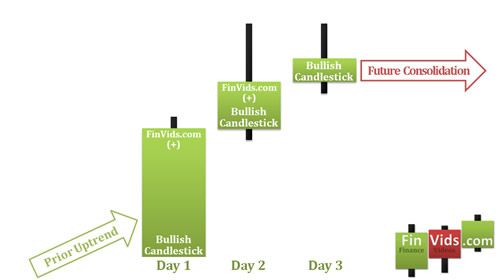
Nison (1991, p. 144) suggests that the advance block and stalled pattern be used to sell out existing longs, but does not suggest going short. The advance block and stalled pattern should not be considered as reversal patterns. Often the advance block and stalled pattern lead into a period of consolidation, though at times they can lead to a reversal of trend to the downside.
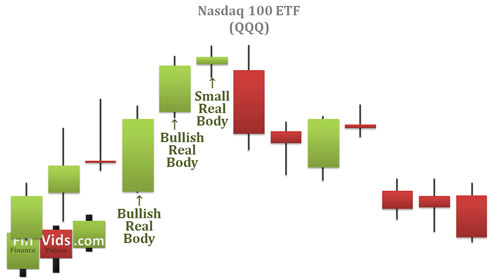
Advance Block Candlestick Chart Example
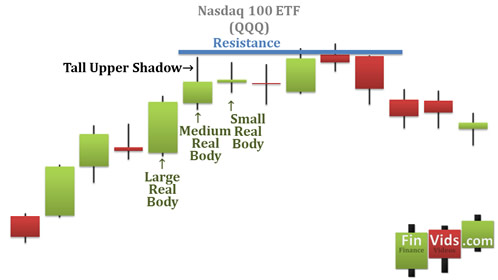
The chart above of the Nasdaq 100 ETF (QQQ) shows an advance block candlestick pattern. The first candlestick of the pattern was a long bullish candlestick that closed near the high of the day. The second day’s candlestick closed above the high of the previous day but was a smaller candlestick than the first day’s real body. Also, the second day had a large upper shadow, showing that the bears “blocked the advance” of the bulls to close at the high of the day. The third day was a small candlestick that was almost a doji, emphasizing that the bulls had run out of power. The third day also had an upper shadow that was unable to go passed the second day’s high price. From there, the market fluctuated at these high prices for four days and then began moving downward.
Stalled Pattern or Deliberation Pattern Candlestick Chart Example
A stalled candlestick pattern is illustrated on the chart above of the Nasdaq 100 ETF (QQQ). The first and second days are both bullish candlesticks. The third day is a small candlestick that barely closes higher than the second day’s closing price. This inability of the bulls to push prices higher shows that they are weakening and either a consolidation period will emerge, or like in the chart above, the bears take over and a downtrend emerges.
Works Referenced
- Nison, S. (2003) The Candlestick Course. Hoboken: John Wiley & Sons.
- Nison, S. (1994) Beyond Candlesticks: New Japanese Charting Techniques Revealed. New York: John Wiley & Sons.
- Nison, S. (1991) Japanese Candlestick Charting Techniques. New York: New York Institute of Finance.
- Rhoads, R. (2008) Candlestick Charting For Dummies. Hoboken: Wiley Publishing.
- ThinkorSwim. (2011). ThinkorSwim Resource Center: Candlestick Patterns Library.
Click "Like" & "+1" for each page